At Medico, we’re often asked about industry standards for paid advertising:
“What’s a good click-through rate?”
“Is my conversion rate what it should be?”
“What can I expect to generate from this level of media spend?”
These questions are critical for healthcare marketers, yet finding reliable benchmarks can be challenging.
The healthcare sector is unique in its advertising dynamics. For example, campaigns aimed at healthcare professionals will have distinct outcomes compared to those targeting patients directly.
A quick search on Google for industry benchmarks in healthcare often yields broad results, sometimes even combining the beauty sector within their analysis. This lack of specificity can be misleading for healthcare marketers who need precise and relevant data.
At Medico, we have built a treasure trove of data from managing ad campaigns in the healthcare sector for years, targeting both patient and healthcare professional (HCP) audiences. Recognising the need for accurate and specific benchmarks, we decided to establish true industry standards for direct-to-patient advertising performance.
Here’s a look at our methodology and findings.
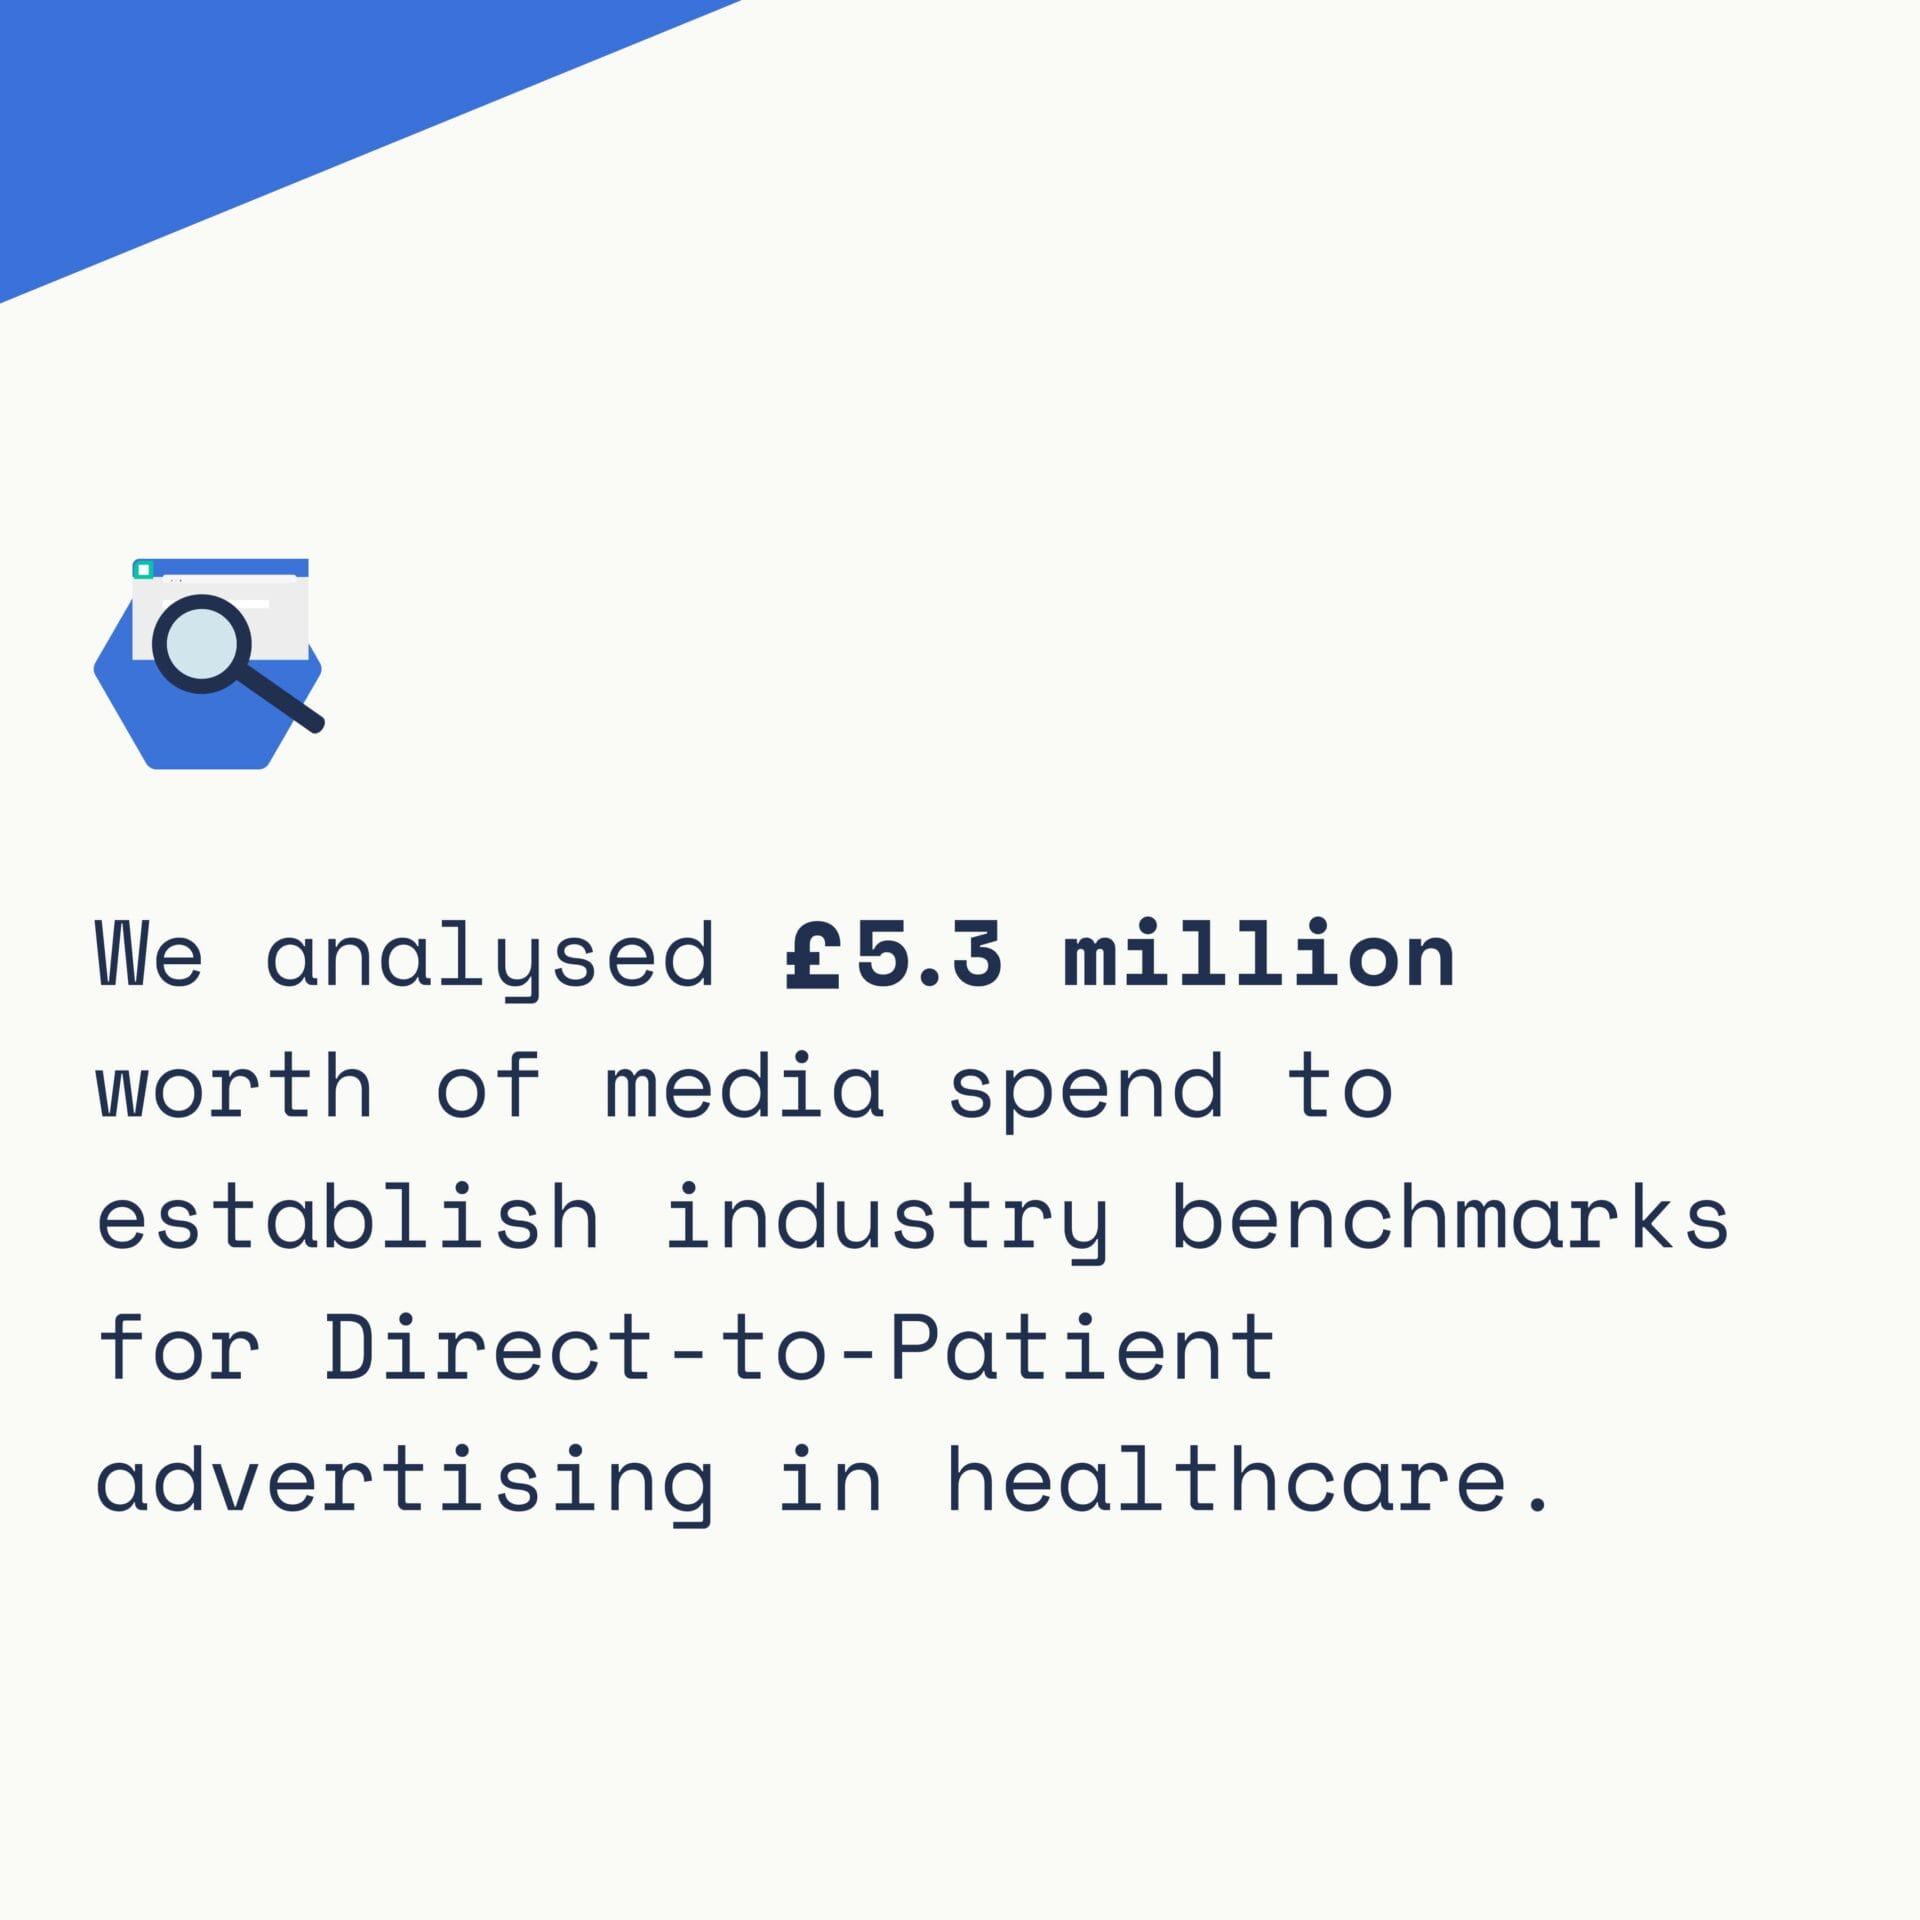
Analysing £5.3 million in direct-to-patient ad spend
Using data from 2023 and 2024, we examined £5.3 million worth of direct-to-patient advertising campaign media spend across over 50 Google ad accounts covering various specialities and client scales. This involved a meticulous analysis from our paid media team who cleaned and categorised over 6,500 data points and conducted statistical analyses to derive meaningful insights.
To ensure the results were as accurate as possible, we excluded the best and worst performance outliers and removed brand search term campaigns which don’t give a true indication of patient intent and would therefore skew the results.
Realistic benchmarks for healthcare advertisers
Our initial findings provide a comprehensive overview of industry benchmarks for typical direct-to-patient advertisers who invest in Google Search, offering a realistic and attainable performance range that healthcare marketers can use to optimise their ad campaigns.

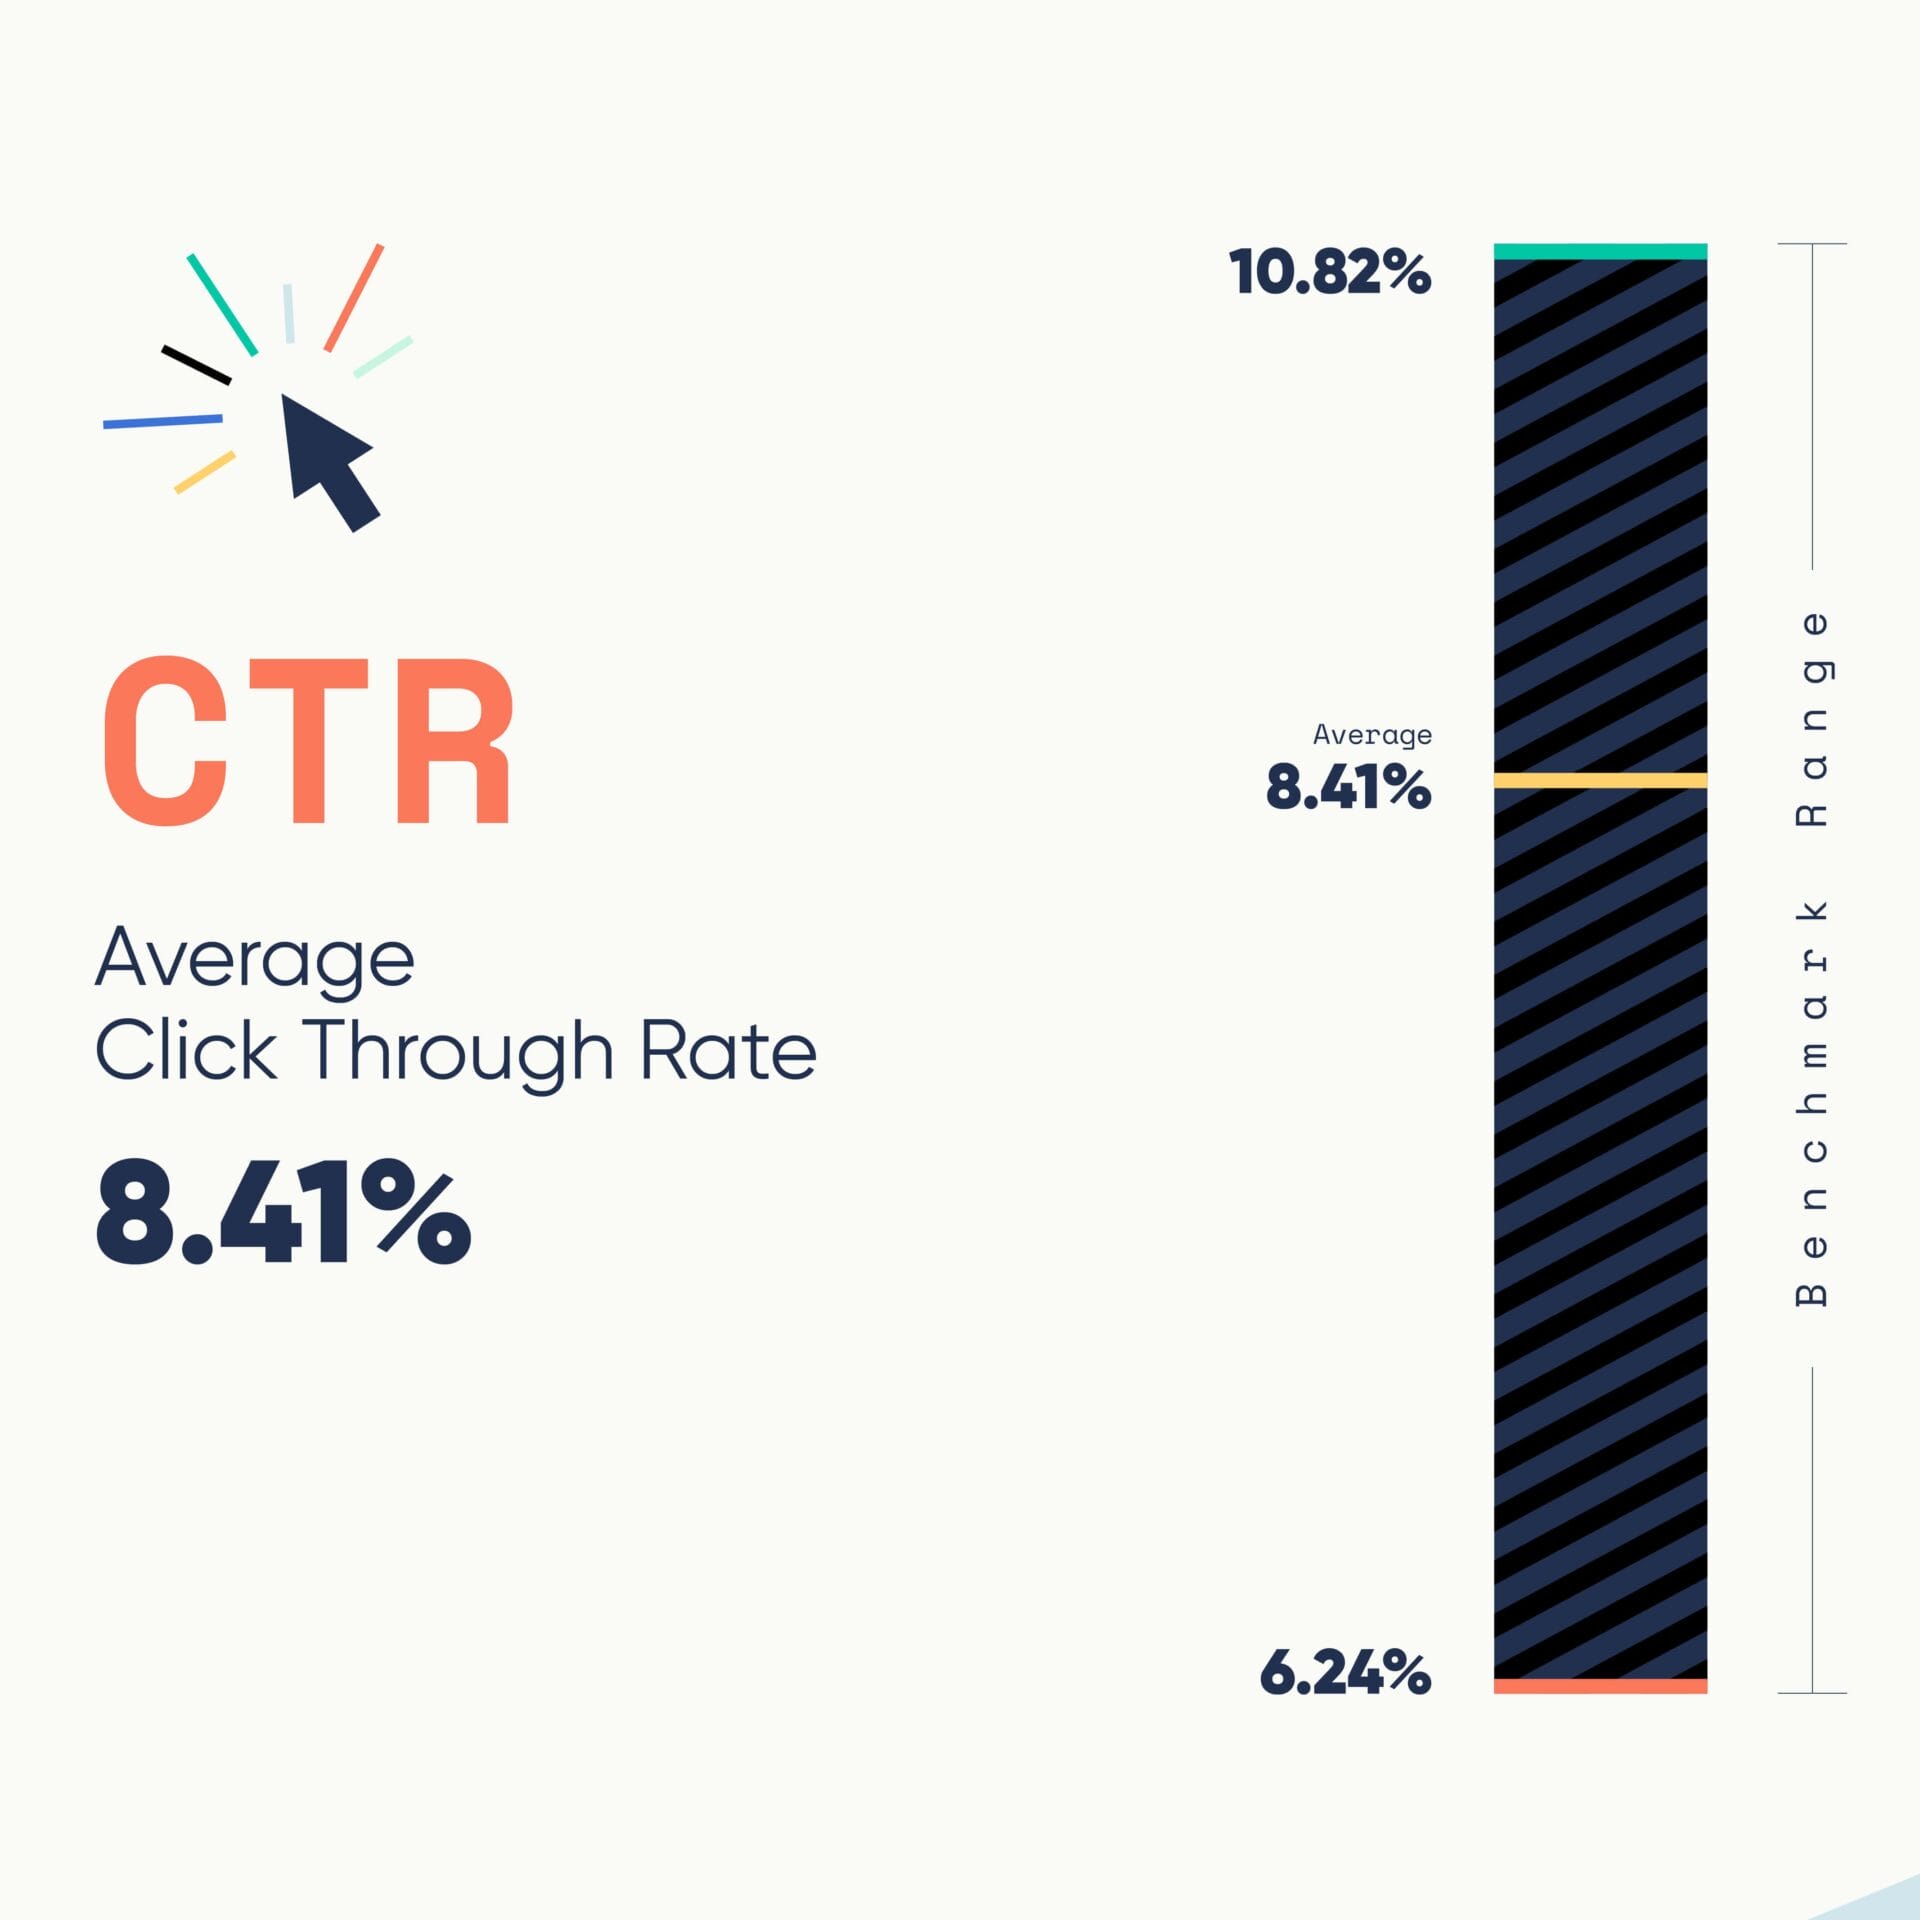
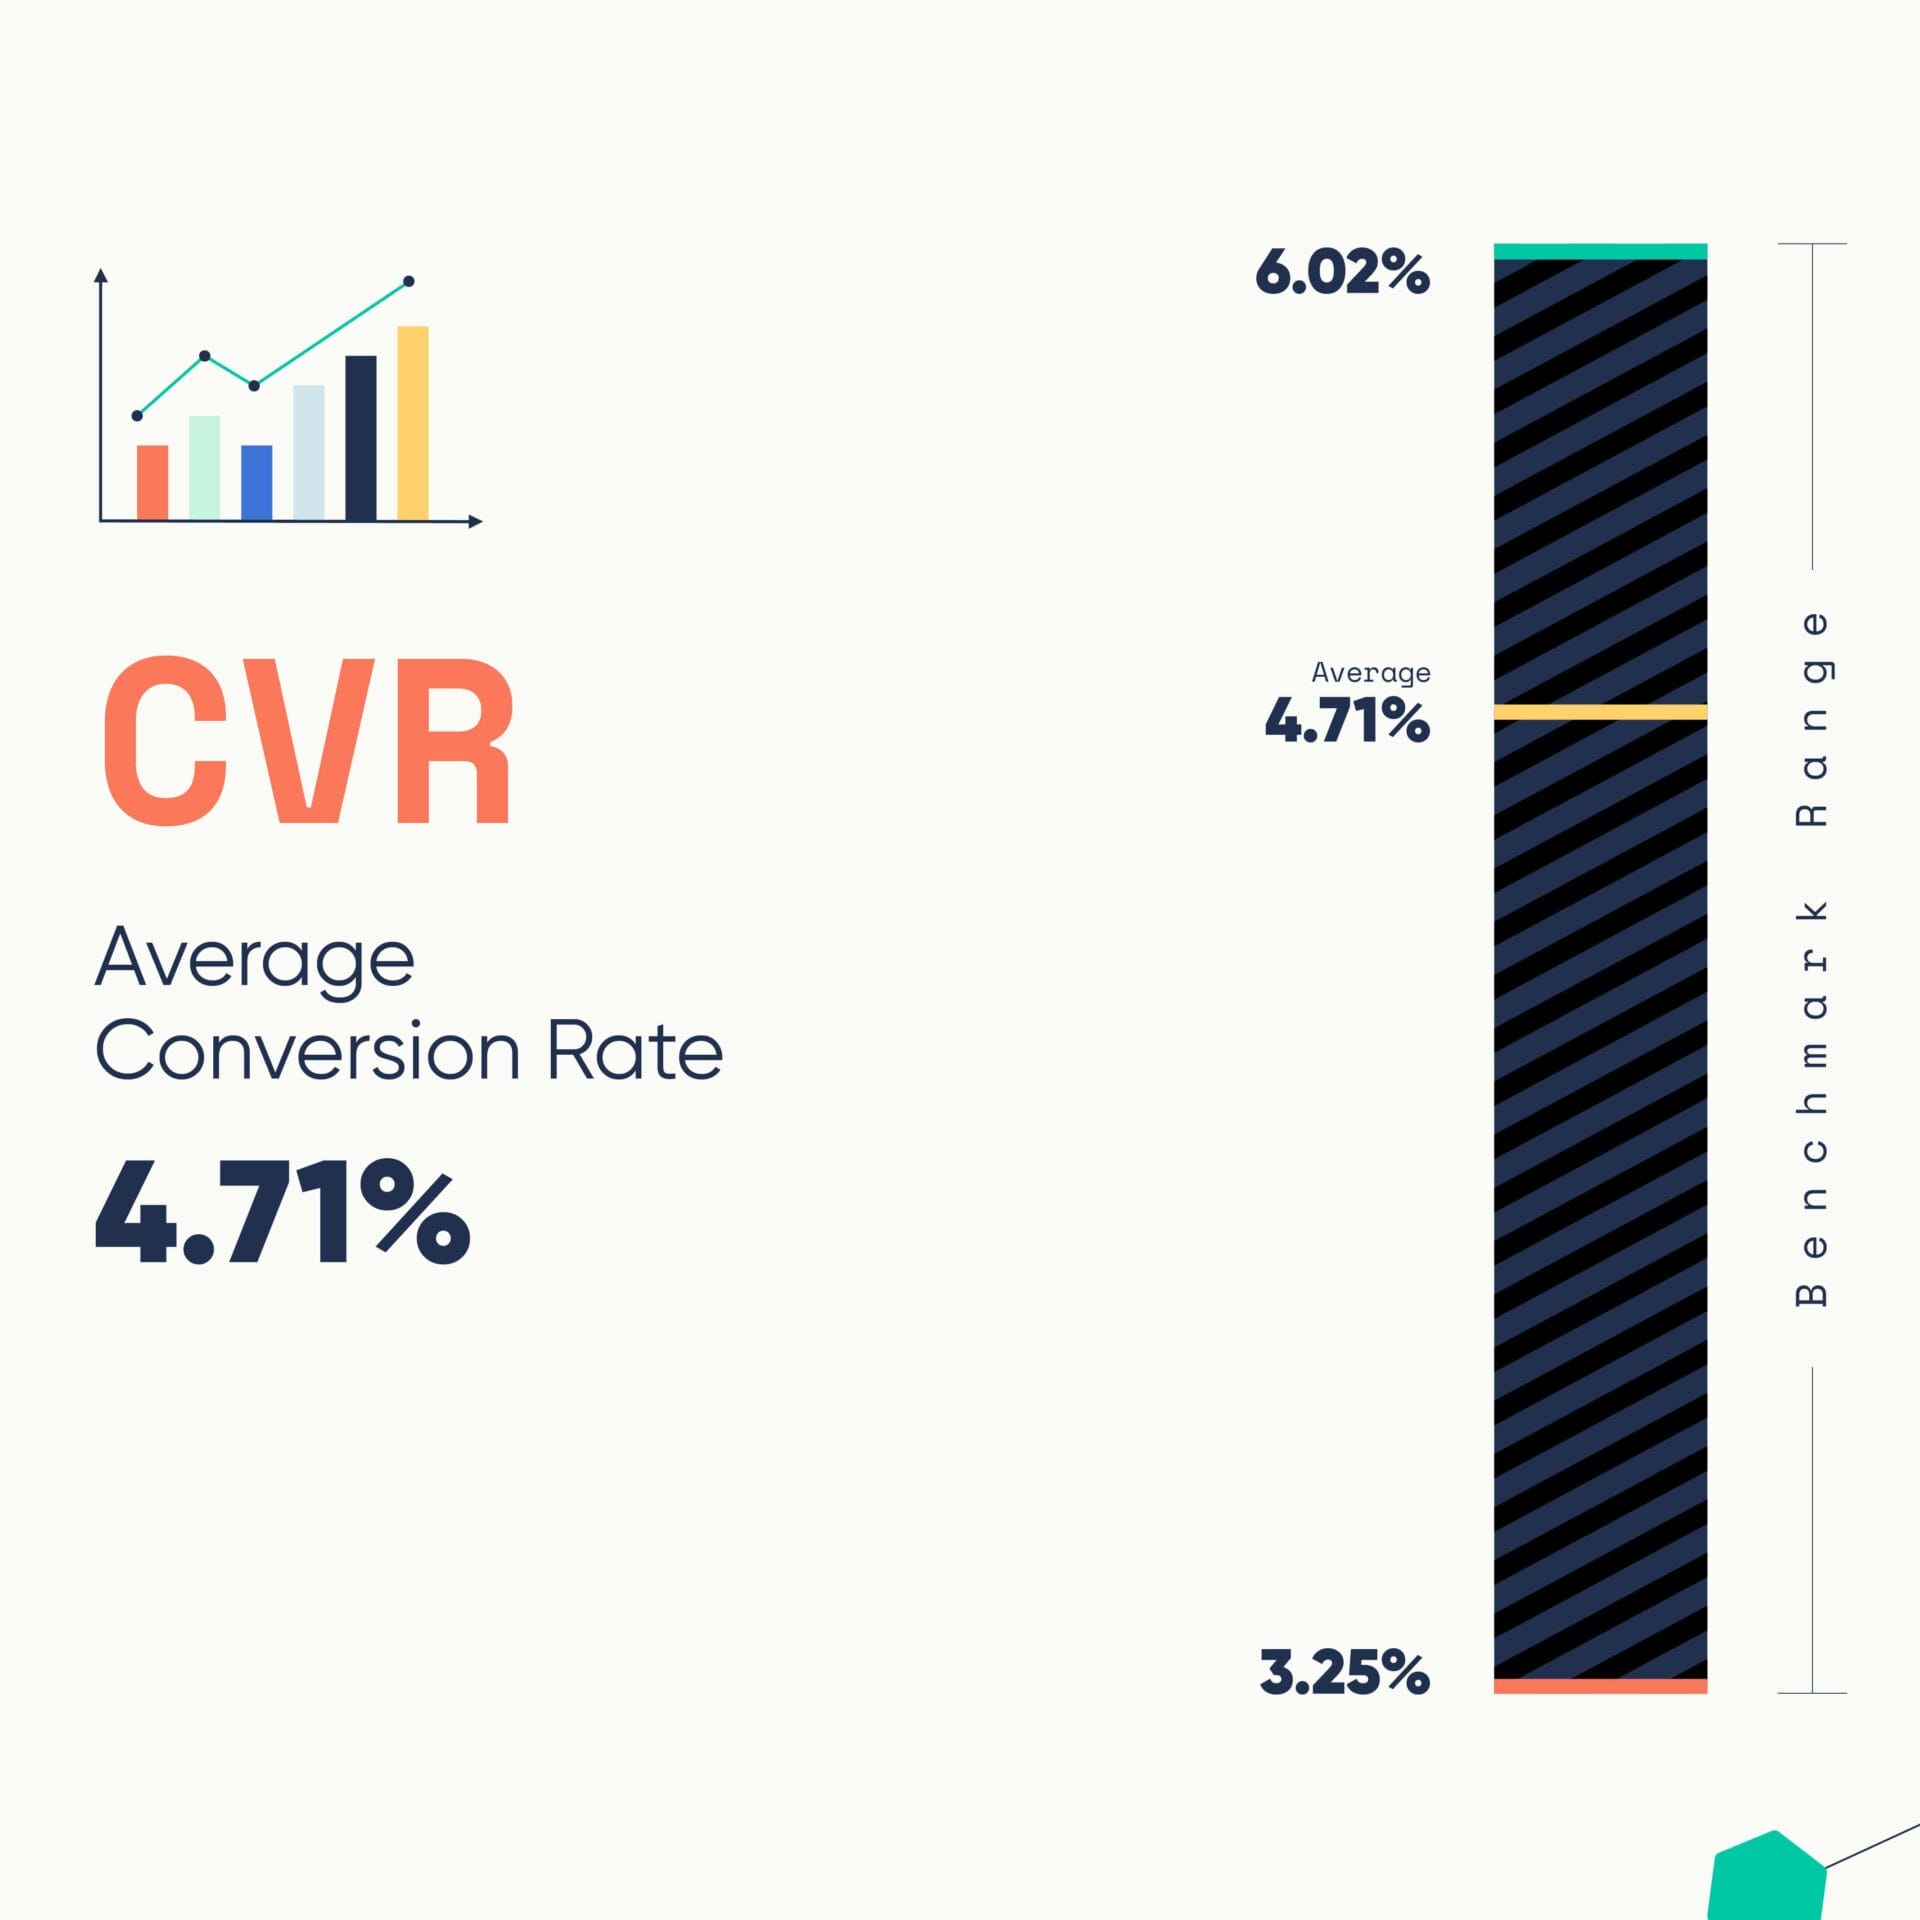

| Metric | Average | Benchmark Range |
| Click-through rate (CTR) | 8.41% | 6.24% - 10.82% |
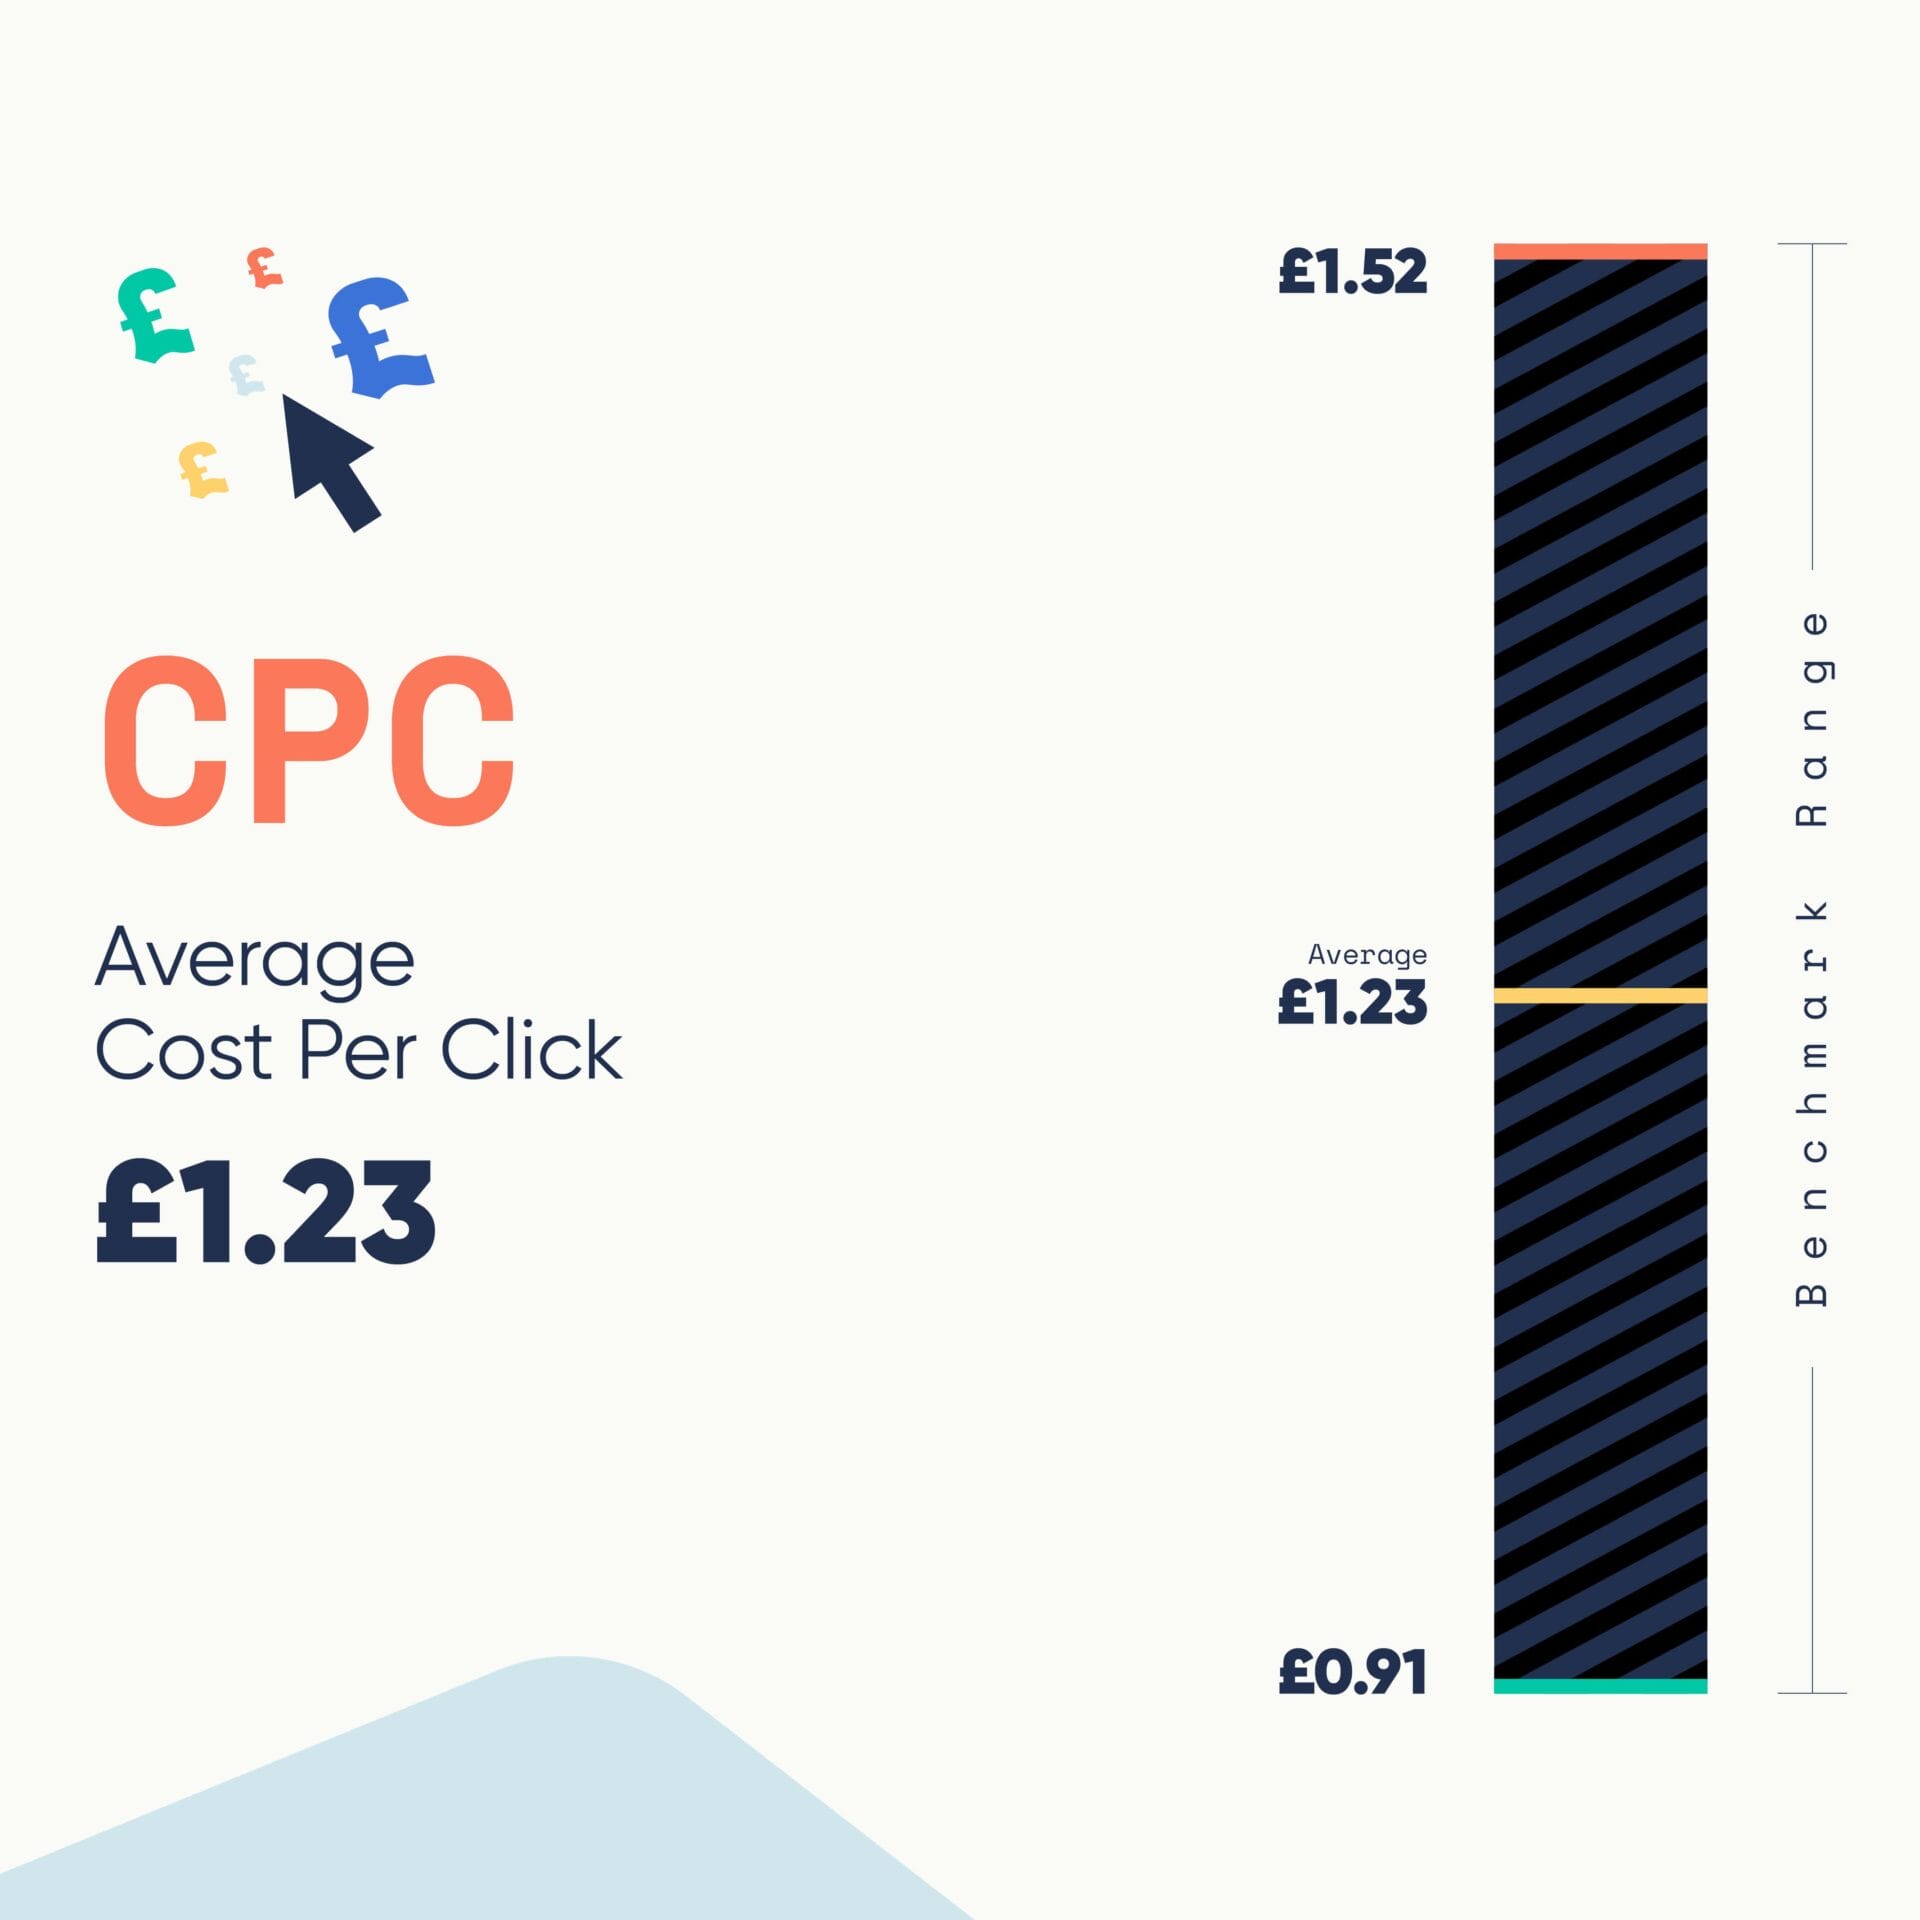
| Cost per click (CPC) | £1.23 | £0.91 - £1.52 |
| Conversion rate (CVR) | 4.71% | 3.25% - 6.02% |
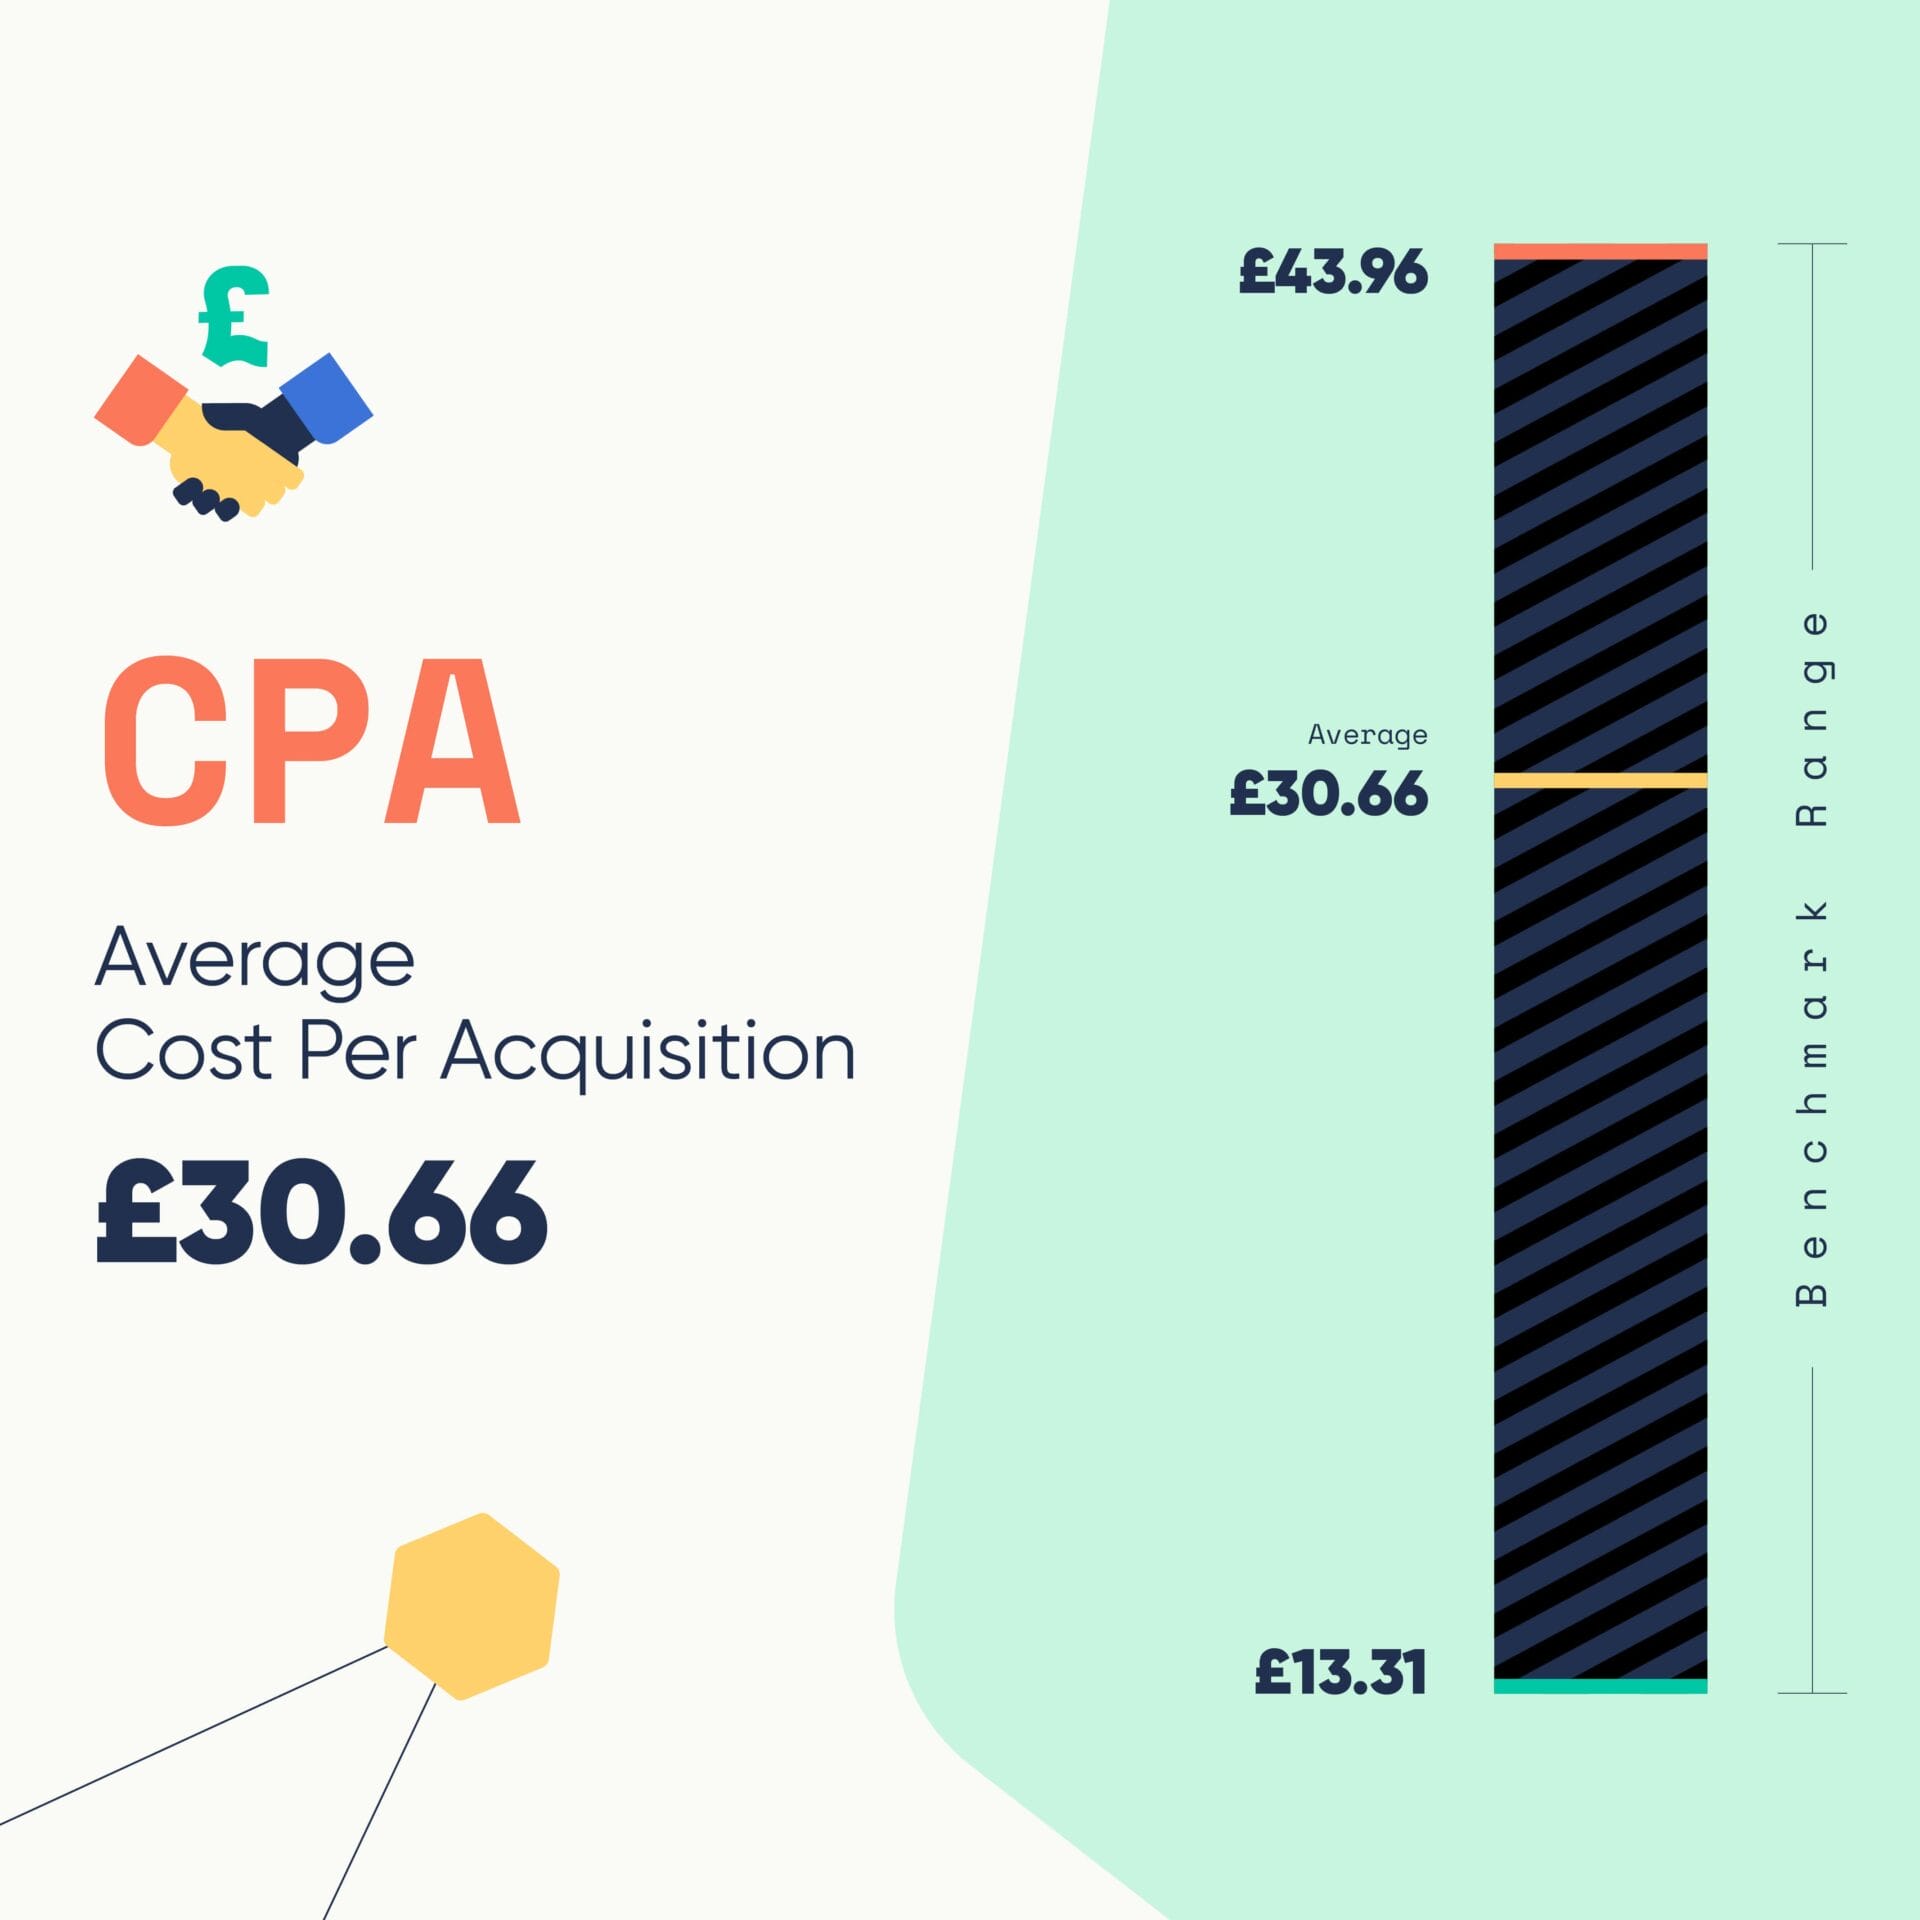
| Cost per acquisition (CPA) | £30.66 | £13.31 - £43.96 |
The rising cost of paid media advertising
According to a Wordstream report from 2021, the average cost-per-lead (CPL) for hospitals and clinics was $33.45. In comparison, our findings show a higher average cost-per-acquisition (CPA) of £30.66 (approximately $38.94), highlighting the competitiveness and investment required in the healthcare advertising sector, making it essential for marketers to understand and leverage these benchmarks effectively.
Segmenting the data by specialities
Our next phase involved breaking down the data further into specific therapy areas, campaign types (e.g. local vs national) and segmenting softer conversion actions e.g. newsletter subscriptions and calls from ads vs harder conversions such as contact form submissions and successful bookings/registrations.
This detailed segmentation provides more precise benchmarks, helping healthcare marketers tailor their strategies effectively.
As we delved deeper into our data, segmenting it by medical specialities, we uncovered fascinating insights into the UK’s healthcare market. Our analysis revealed significant variations across different fields, each telling its own story about patient needs, market dynamics, and the evolving landscape of private healthcare.
| Specialty | CTR | CPC | CVR | CPA |
| Cardiology | 7.43% | £1.63 | 5.01% | £26.33 |
| Cosmetic | 7.86% | £1.64 | 3.42% | £62.74 |
| Dermatology | 9.44% | £1.10 | 9.81% | £11.24 |
| Endocrinology | 6.13% | £0.83 | 4.84% | £17.25 |
| ENT | 9.13% | £1.37 | 7.69% | £17.82 |
| Fertility | 7.78% | £2.51 | 4.63% | £54.58 |
| Gastroenterology | 7.46% | £1.21 | 6.74% | £17.97 |
| General Practice | 10.38% | £1.39 | 8.18% | £16.06 |
| General Surgery | 7.57% | £1.76 | 2.41% | £59.44 |
| Gynaecology | 9.89% | £1.06 | 6.77% | £15.73 |
| Diagnostic Imaging | 6.87% | £1.74 | 6.67% | £33.73 |
| Mental Health | 7.69% | £1.47 | 3.17% | £46.35 |
| Neurology | 7.75% | £1.07 | 3.72% | £33.11 |
| Oncology | 10.96% | £0.62 | 6.55% | £21.78 |
| Online Pharmacy | 5.28% | £1.12 | 6.67% | £16.78 |
| Ophthalmology | 10.08% | £1.75 | 2.45% | £98.89 |
| Orthopaedic | 10.10% | £1.17 | 1.80% | £56.23 |
| Urology | 9.61% | £0.99 | 7.06% | £13.98 |
Oncology emerged as a standout performer, boasting the highest click-through rate at 10.96% and an impressive conversion rate of 6.55%. These figures likely reflect the critical nature of cancer treatment and patients’ willingness to explore private options for timely care. Similarly strong performances were seen in General Practice and Gynaecology, suggesting a robust demand for accessible general healthcare and women’s health services in the self-pay market.
When it comes to cost efficiency, Oncology and Endocrinology led the pack with the lowest cost per click. This could indicate lower competition in paid search for these specialities relative to demand. On the other hand, Cosmetic and Orthopaedic specialities showed high costs per acquisition, likely due to the elective nature of many procedures in these fields and the significant decision-making process involved for patients.
Unsurprisingly, some highly competitive specialities like Orthopaedics and Ophthalmology displayed lower conversion rates. This could be attributed to the complexity and cost of treatments in these areas, which may require more consideration from patients. The long NHS waiting lists for procedures such as joint replacement surgeries and cataract operations are likely contributing factors to the high competition in these fields. Similarly, the increasing demand for private hernia surgeries seems to be reflected in the data for General Surgery.
Efficiency standouts included Dermatology and Urology, which demonstrated strong performance across click-through rates, conversion rates, and cost per acquisition. This efficiency suggests these specialities are effectively attracting and converting interested patients at a lower cost, possibly due to the prevalence of common conditions that patients prefer to address privately.
Mental health services are gaining significant attention in our data, with moderate spending and engagement rates. This trend reflects a growing awareness and demand for mental health care, likely exacerbated by the well-documented lack of provision within the NHS. However, the conversion rates tell an intriguing story: while many people are clicking on ads for mental health services, fewer are proceeding to engage. This disparity could be attributed to several factors, including the persistent stigma surrounding mental health issues, the costs associated with private mental health services, or perhaps a hesitation to commit to long-term treatment. It’s a complex picture that underscores both the increasing recognition of mental health’s importance and the challenges that remain in making these services accessible and appealing.
These insights paint a vivid picture of the UK private self-pay market. They highlight areas of high demand, reflect patient priorities, and reveal potential growth opportunities. From the need for quick access to basic healthcare, to the willingness to pay out-of-pocket for faster service and specialist consultations, our data aligns closely with current trends in healthcare advertising.
As we continue to analyse and interpret this rich dataset, we’re excited to uncover more nuanced insights that can help healthcare providers tailor their services and marketing strategies to meet evolving patient needs effectively.
If you have any questions or are interested in a free audit of your PPC activity, get in touch today.